WebRTC debugging from dump to diagnosis
rtcStats combines open-source collection tools with a cloud analysis platform. You collect the stats, we surface the root causes - experience scores, observations, deductions, and actionable insights your team can act on immediately.
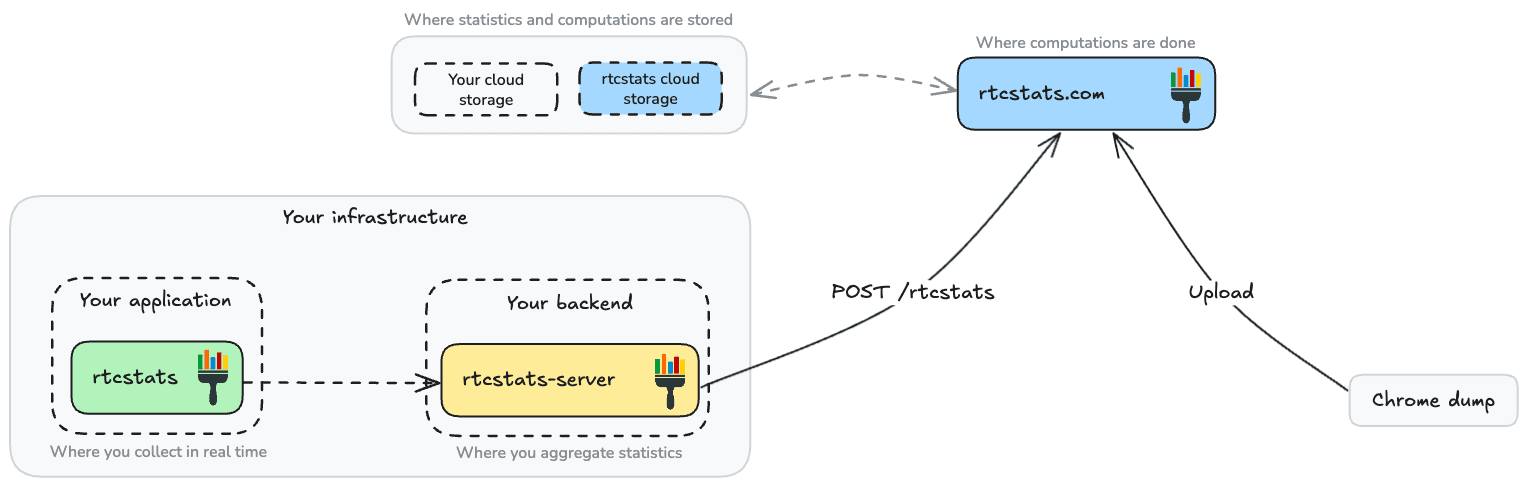
How it works
rtcstats (SDK)
Open-source client SDK that collects WebRTC statistics from your application automatically. Drop it in, point it at your collection server or use the built-in websocket transport, and every session is captured.
rtcstats-server
Open-source collection server that receives stats via websocket and stores them for analysis. Scales horizontally, anonymizes IP addresses by default, and connects directly to rtcstats.com when you want cloud analysis.
rtcstats.com (Cloud)
Upload a webrtc-internals dump or connect your SDK pipeline. Every session gets an experience score, AI-powered observations, and root-cause deductions. Free plan included - no credit card, no expiration.
What your analysis looks like
Every session is broken down across five analysis views. Here's what you get.
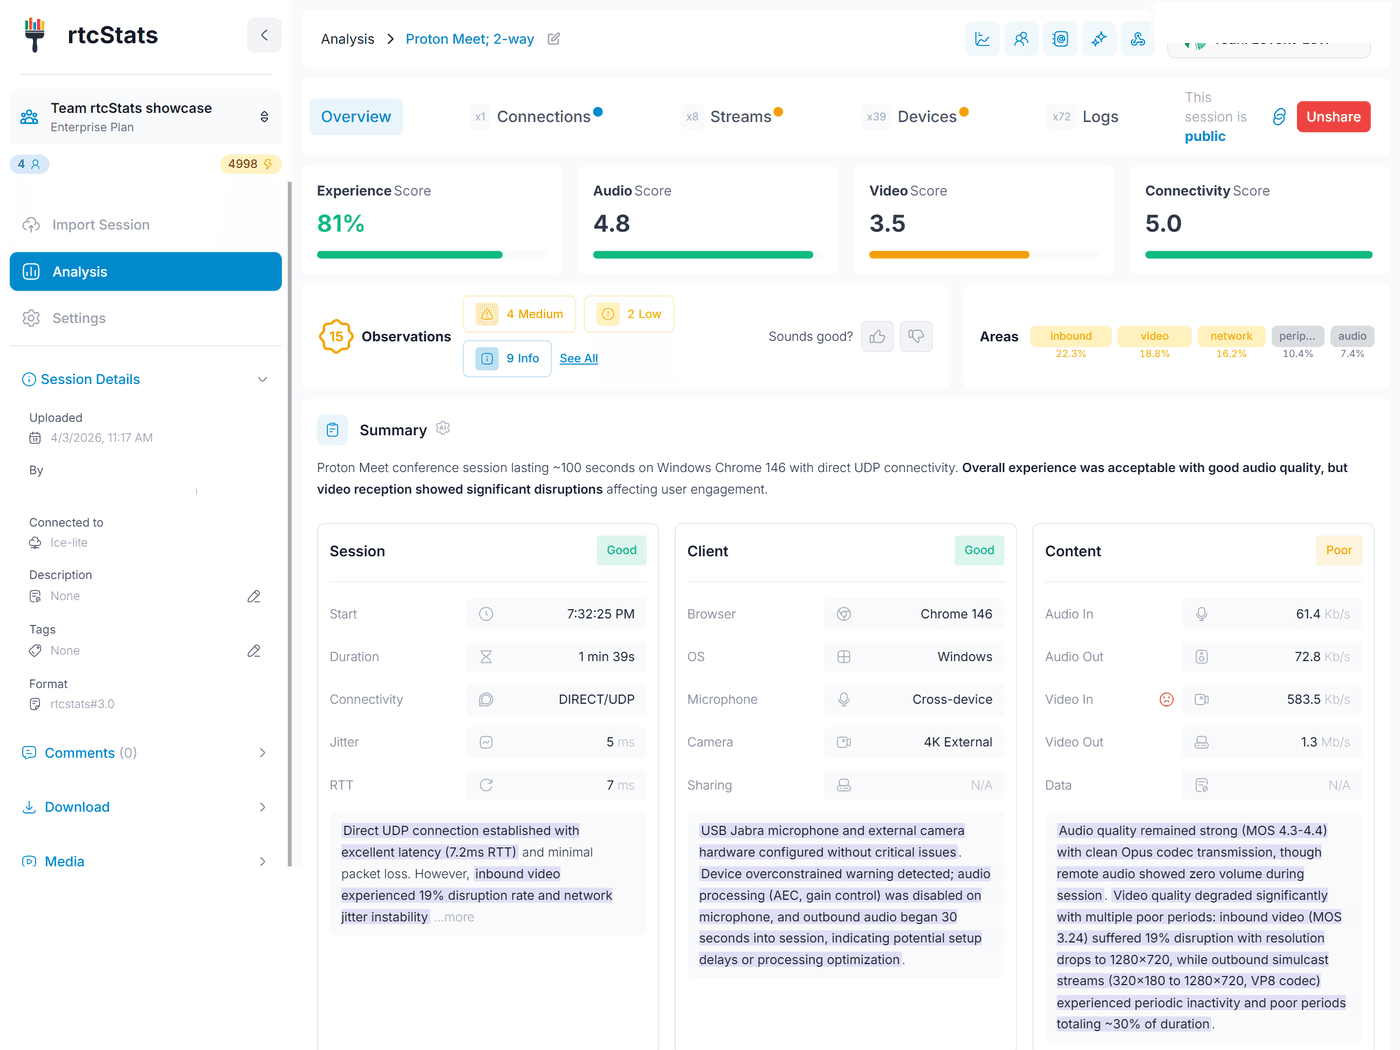
The full picture in one scroll
Every session starts here. Experience score, audio/video/connectivity scores, AI-generated observations, and a plain-English summary of what happened and why.
- Experience score from 0-100% with severity-ranked observations
- AI summary that explains issues in human language
- Session, Client, and Content cards with per-area deductions
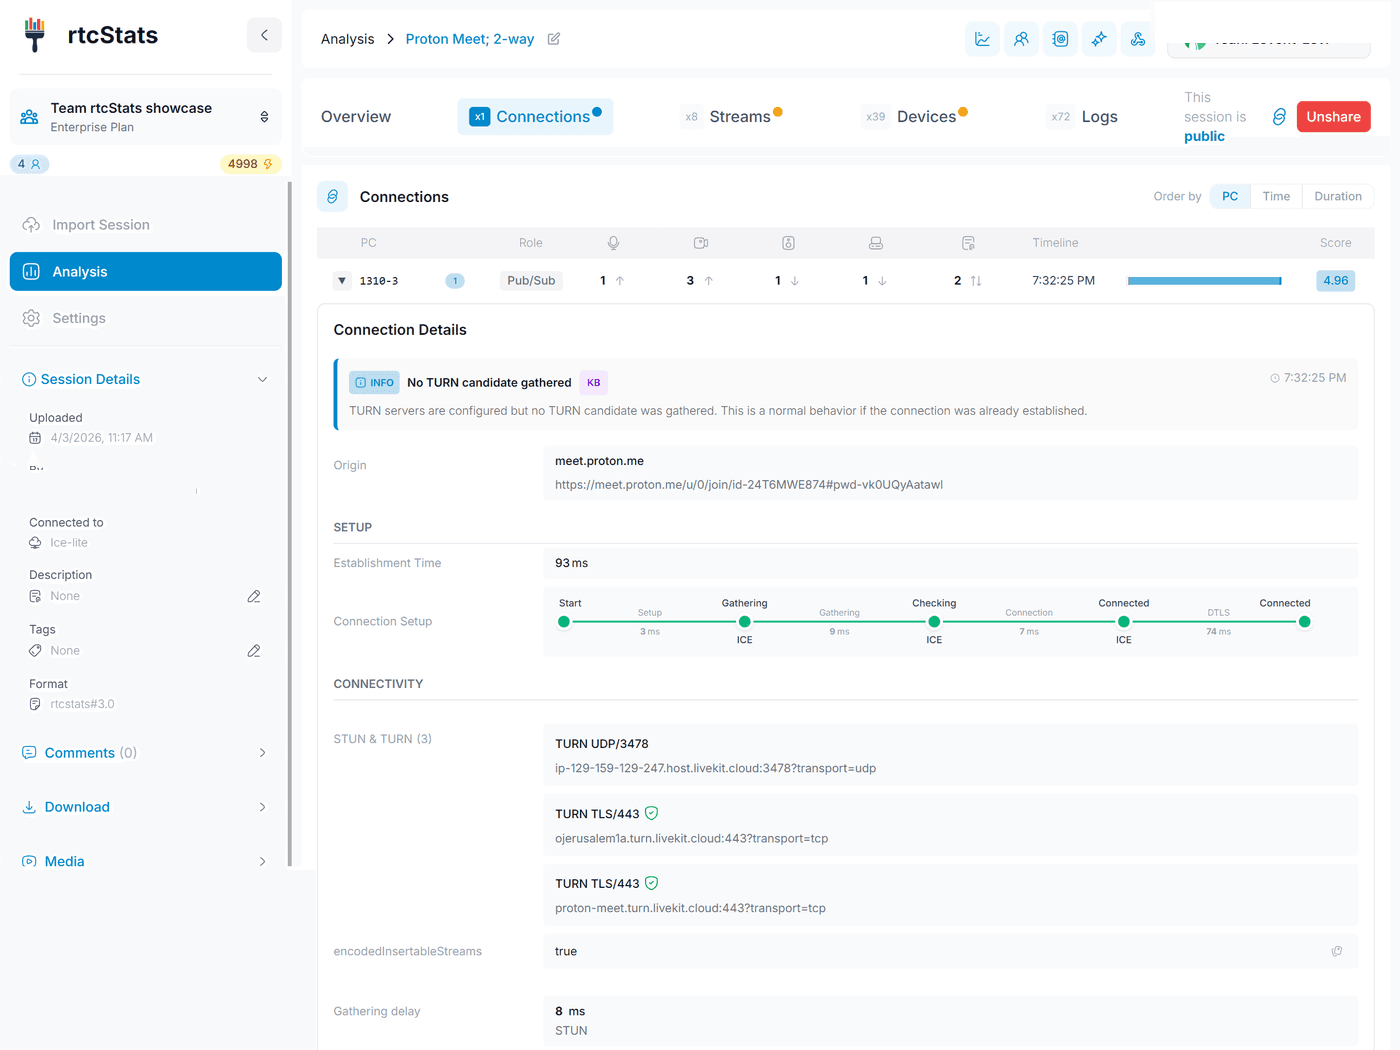
See how the connection was built
ICE candidate pairs, relay vs direct paths, DTLS handshake timing, and connectivity observations. Know whether the call went through a TURN server and why.
- ICE candidate pair timeline with state transitions
- Local and remote candidate types (host, srflx, relay)
- Connection-level observations flagging relay fallbacks or failures
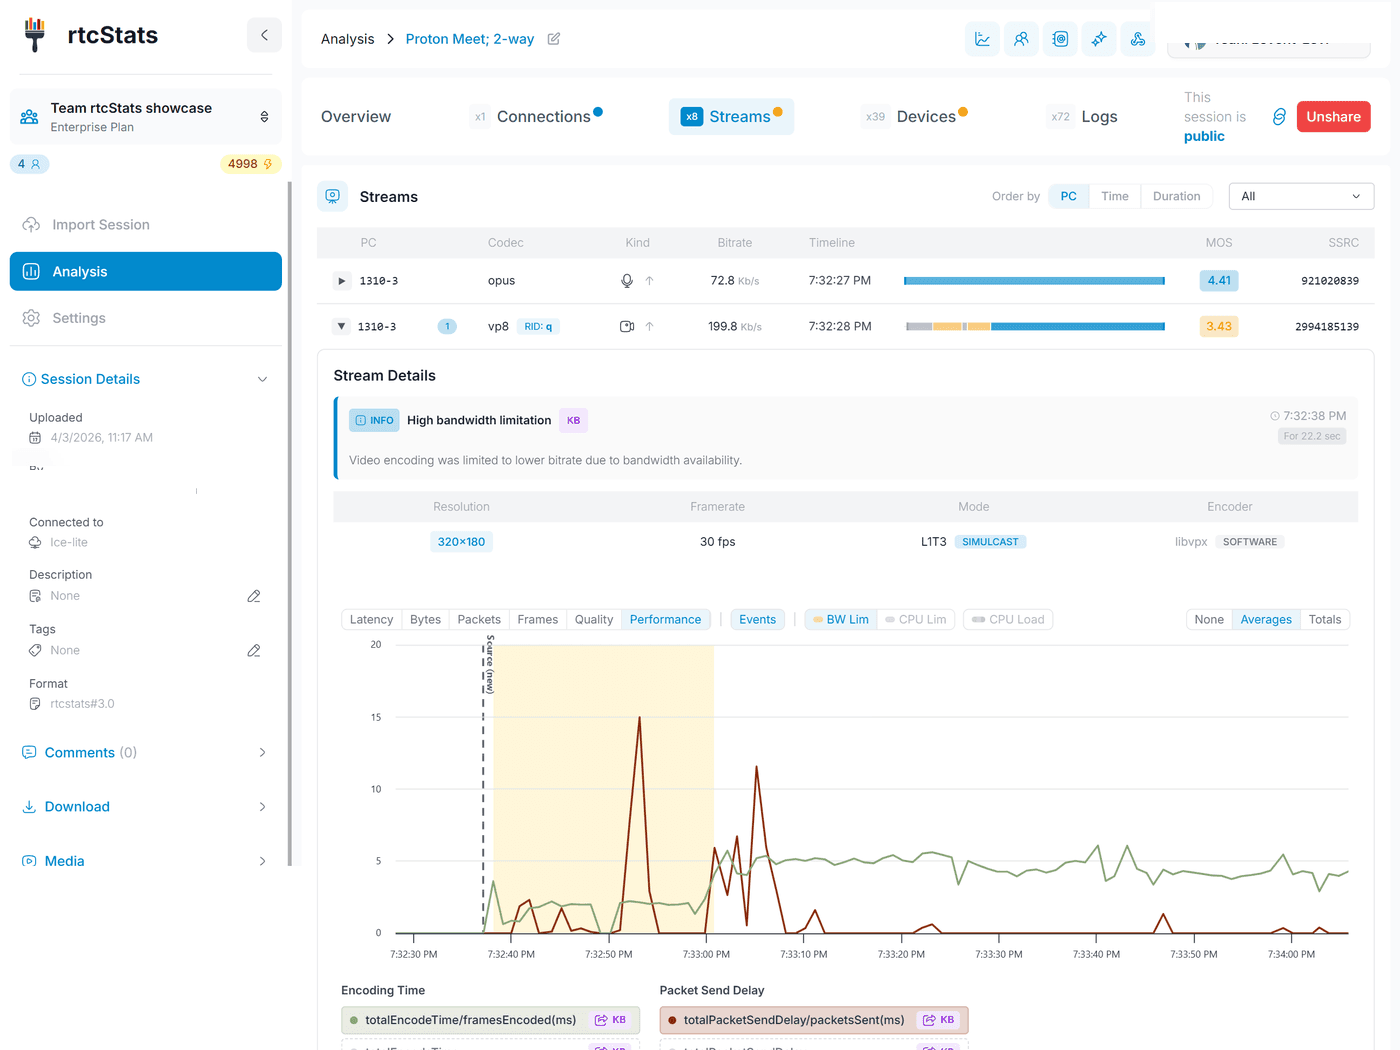
Audio and video under the microscope
Per-stream bitrate, packet loss, jitter, and round-trip time over time. Spot bandwidth limitations, codec switches, and quality degradation the moment they happen.
- Time-series charts for every inbound and outbound stream
- Bandwidth limitation observations with timestamps
- MOS scores, codec info, resolution and framerate tracking
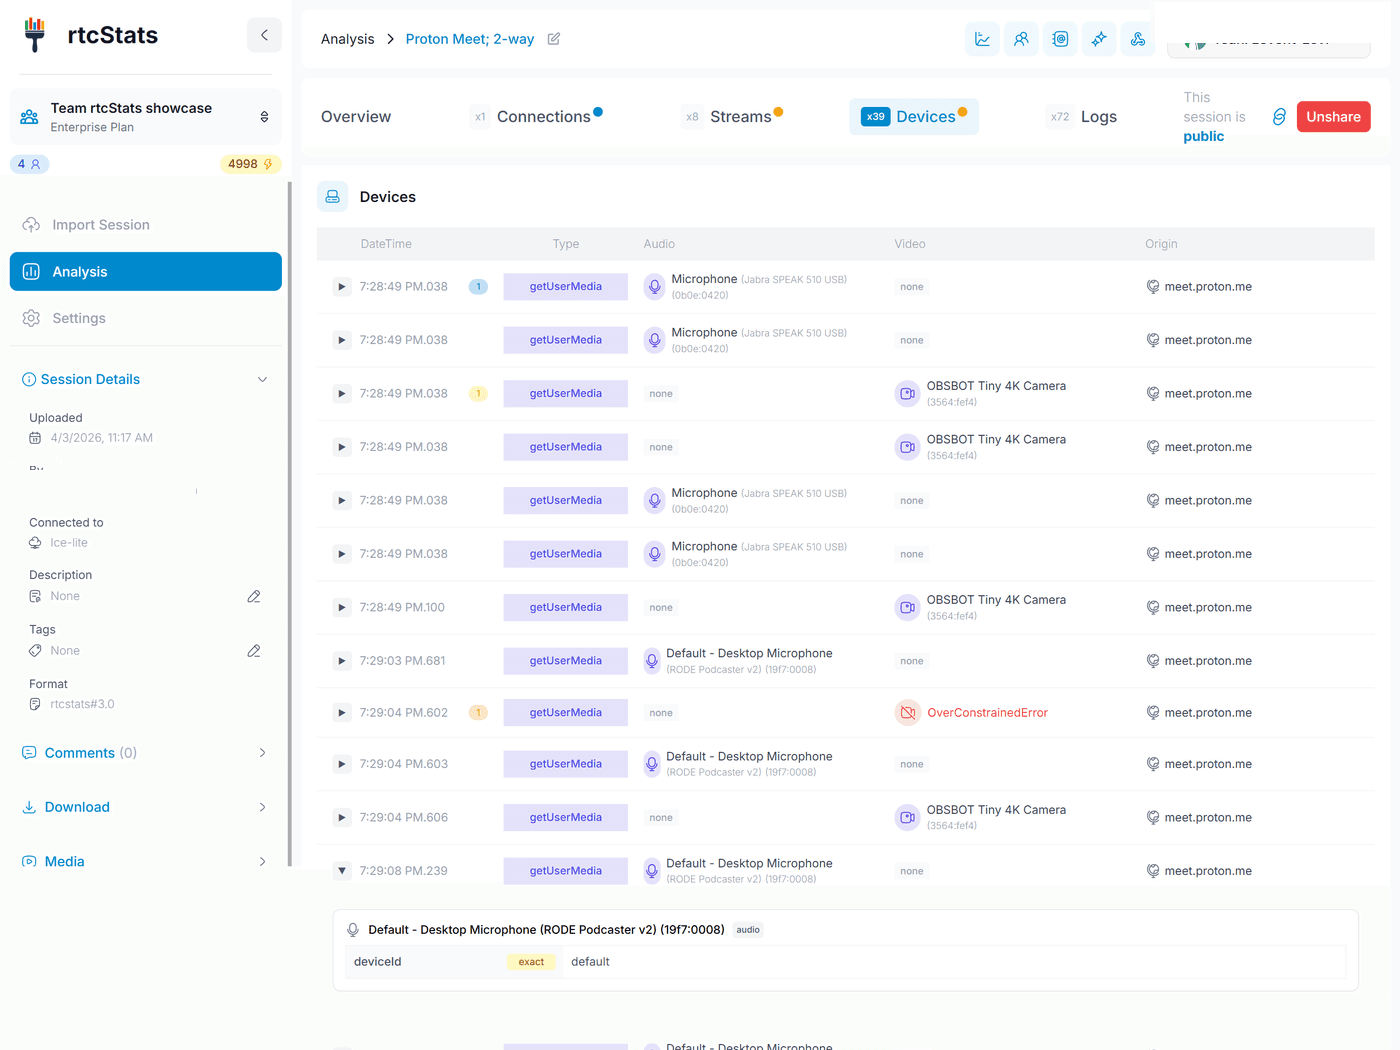
Every device change, tracked
Full device enumeration history - cameras, microphones, speakers, and screen shares. See which devices were available, which were selected, and when they changed.
- Device inventory with labels, groupIds, and capabilities
- Mid-call device switches and permission changes
- Observations flagging missing or failed device access
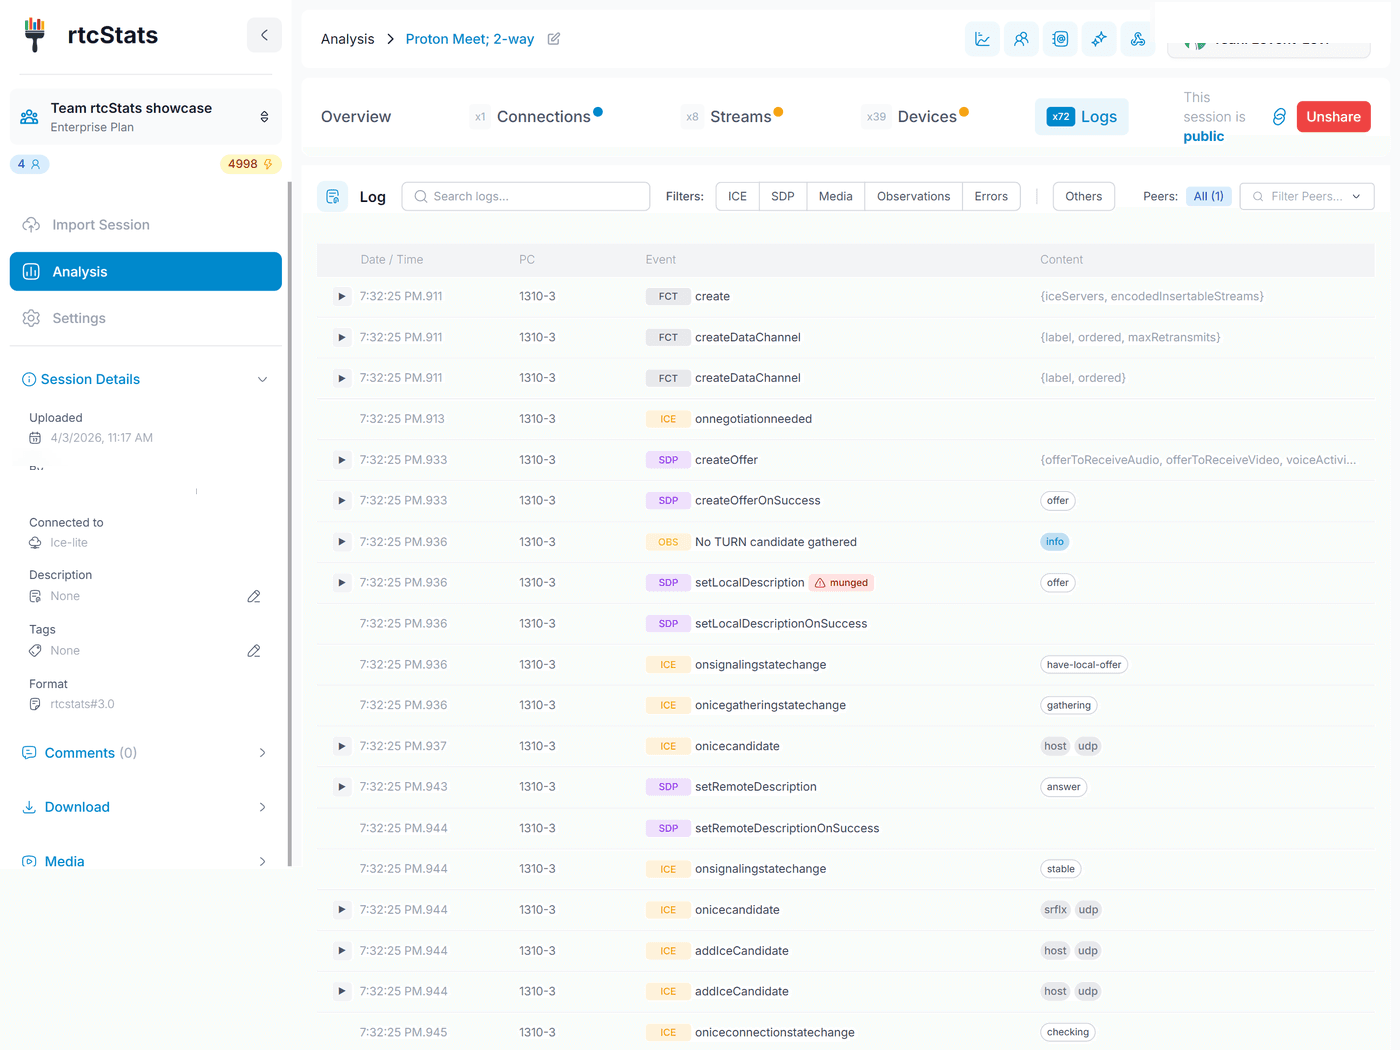
The full event timeline
Every SDP negotiation, ICE event, track addition, and state change in chronological order. Filter by type, search by keyword, and trace the exact sequence that led to a failure.
- Color-coded severity levels for quick scanning
- Filterable by event type, connection, and direction
- Full SDP offer/answer diffs for codec negotiation debugging
Why rtcStats?
Own your data: Your stats stay in your infrastructure until you choose to analyze them. The open-source SDK and server are fully self-hosted. You decide what gets shared, where it's stored, and how long it's kept.
Easy integration: Add the SDK to your app in minutes. It works alongside any WebRTC stack - no vendor lock-in, no proprietary agents, no code changes to your media pipeline.
Built by WebRTC experts: Created by engineers who have spent decades in the WebRTC ecosystem. The analysis isn't generic - it understands codec negotiation, ICE connectivity, simulcast behavior, and the edge cases that generic monitoring tools miss.
See it in action
Explore real analyses of LiveKit, NVIDIA, Netflix, and more.
